TOYOTA SALES EVENTS A/B TESTING
Roles: Strategy Lead, Experience Design Lead

Setting the scene
For over a year, the control XD and creative for quarterly sales events held steady, but the numbers weren’t exciting. Despite being a huge revenue stream for our client, the initiative had somehow fallen down on the list of priorities and wasn’t being given the strategic attention that it required. I saw it as an opportunity to provide a little focused attention to move the needle for our clients.
The Hypothesis
After usability testing on several enterprise projects including the Toyota.com and Local Specials redesigns, I understood that segmenting customers too early in the funnel was a recipe for abandonment. The control creative did just that by giving specific offers rather than using a more general offer coupled with progressive disclosure to bring people into the experience to explore for themselves.


competitive research
To prove my hypothesis, I did a competitive analysis of our OEM competitors and found that their current sales event homepage creative supported my hypothesis. But I took it a step further and looked at archive.org to see, historically, what each OEM had done with their homepage creative over the last several years and when their creative changed to the current structure. Competitors with smaller vehicle line-ups often showed a beauty shot of all vehicles without any specific incentives called-out.

The test plan
There was split support for the hypothesis. To satisfy all stakeholders, we designed a multivariant test.
A (Control): All offers CTA at top of page links to the general Local Specials page. The specific offer CTAs link to that specific offer.
B (Challenger 1): All offers CTA at top of page links to the general Local Specials page. Individual CTAs link to specific offers.
C (Challenger 2): All offers CTA at top of page links to the general Local Specials page. Individual CTAs link to offers for cooresponding vehicle.

User flow
Illustrates how A (Control) and B (Challenger 1) link to specific offer pages, while C (Challenger 2) links to the more general vehicle-specific offers.
KPIS
All core KPIs were still measured in this test as a whole, in relation to the entire site (RAQ, Clicks to Build, Clicks to Search Inventory, Config Starts and Completes and Dealer Site Visits).
Specific KPIs:
# clicks on each vehicle that lead to vehicle specific Local Specials page for that vehicle (i.e # clicks on Camry on Homepage going to vehicle-specific Local Special)
“View Offer” CTA clicks on both the Control and Competitors
# leads generated from each version
Organic visits vs. bookmark visits for each version
Results

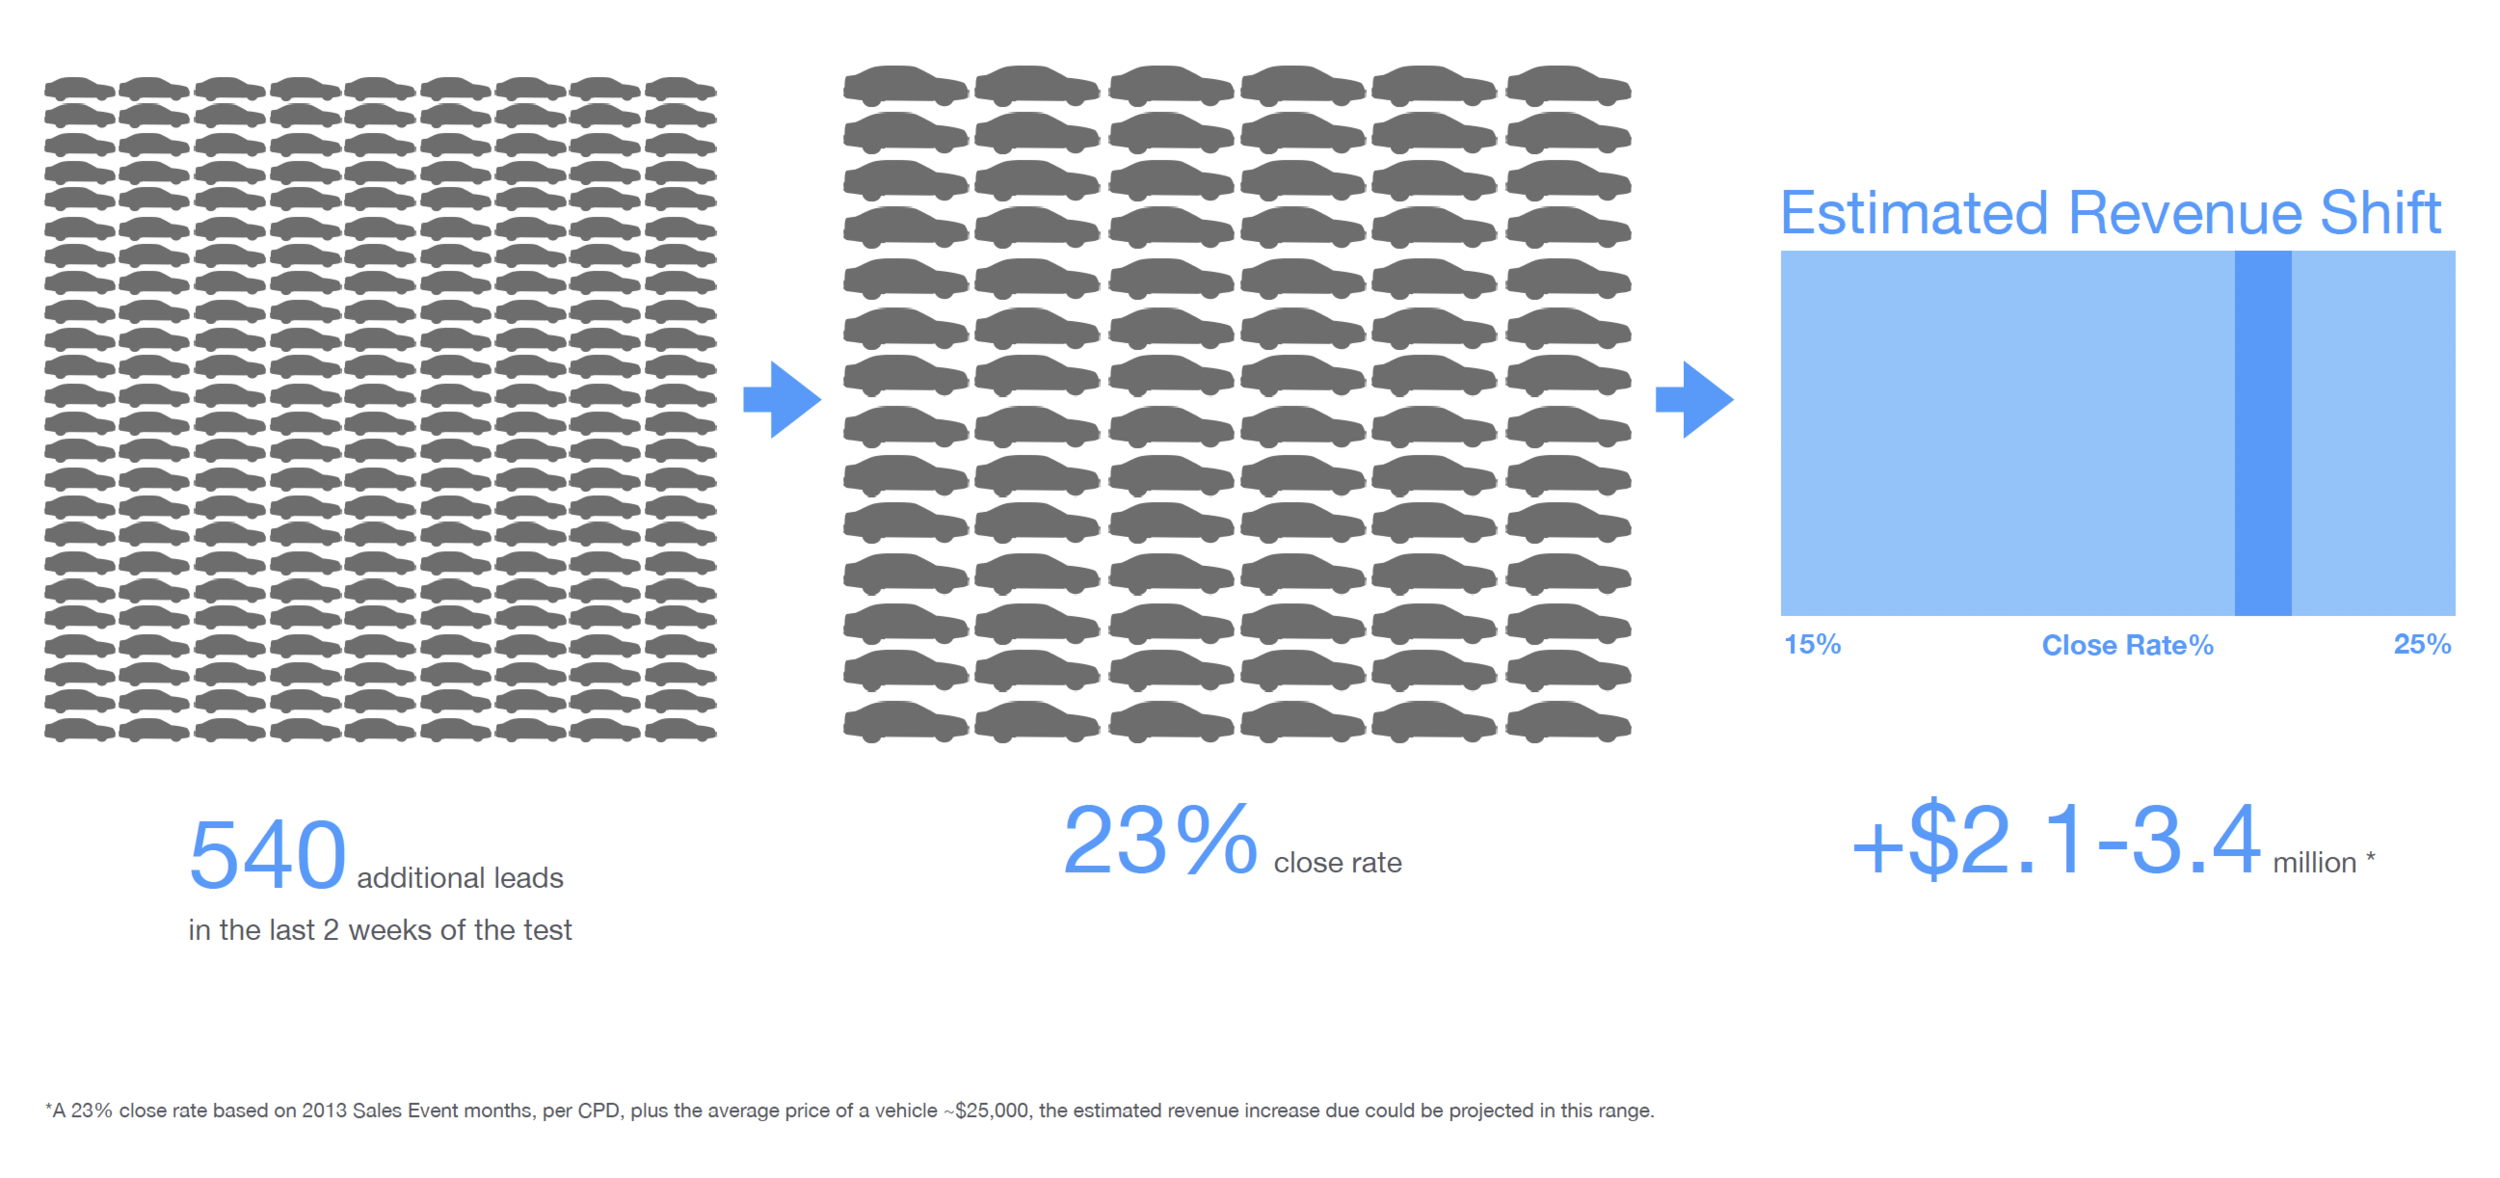
Postscript
The winner, Challenger 2, became our new control. We expanded the test to the Model Landing Pages and began testing creative variants (photos, backgrounds, etc) to see if we could get any additional lift in leads. Once dependencies like Local Specials and the Enterprise Factory Configurator were launched, continue to apply similar tests across all breakpoints.